Central Okanagan Real Estate Market Update - April 2024
Posted by Dave Kotler on Wednesday, April 3rd, 2024 at 6:06am.
 Welcome to our exploration of the Central Okanagan real estate market! From Kelowna up to Lake Country and down through Peachland, this region is known for its wineries and beautiful outdoor activities. It's no wonder why so many people love to live here. Whether you want to join them or are simply curious, here's a breakdown of the market in March 2024.
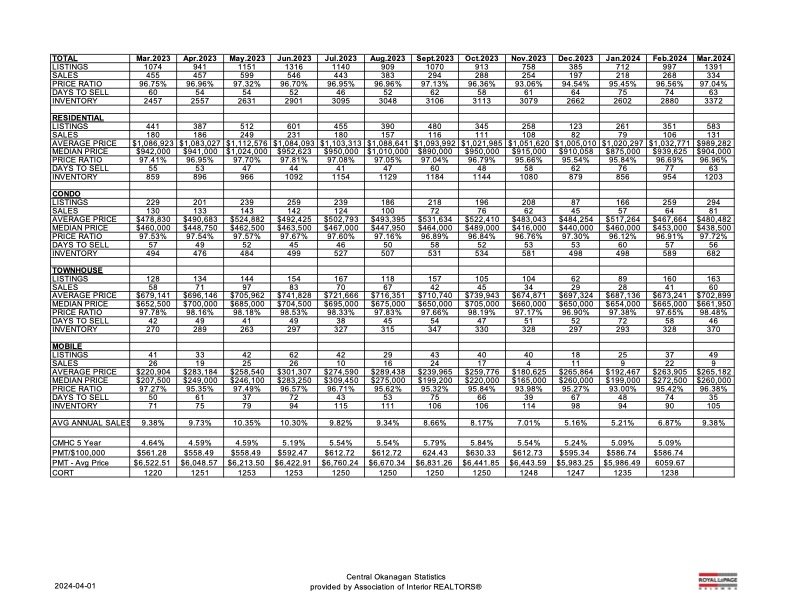
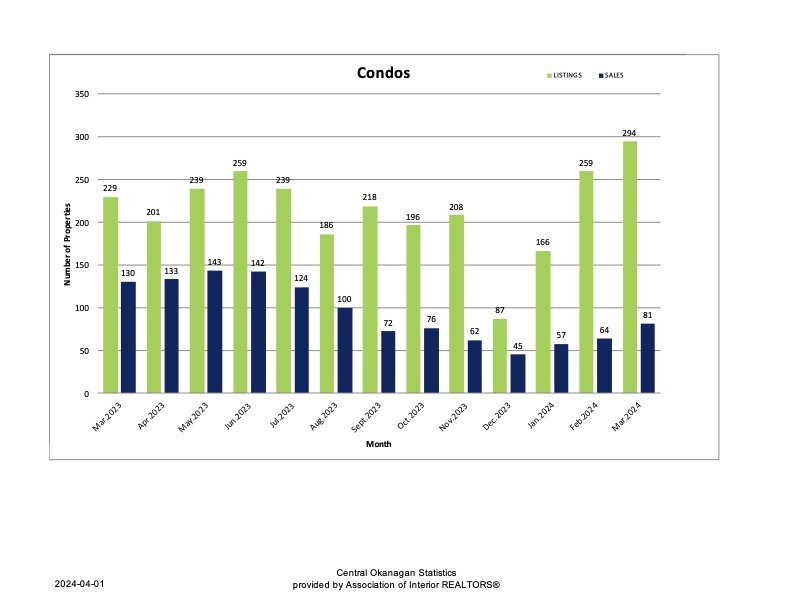
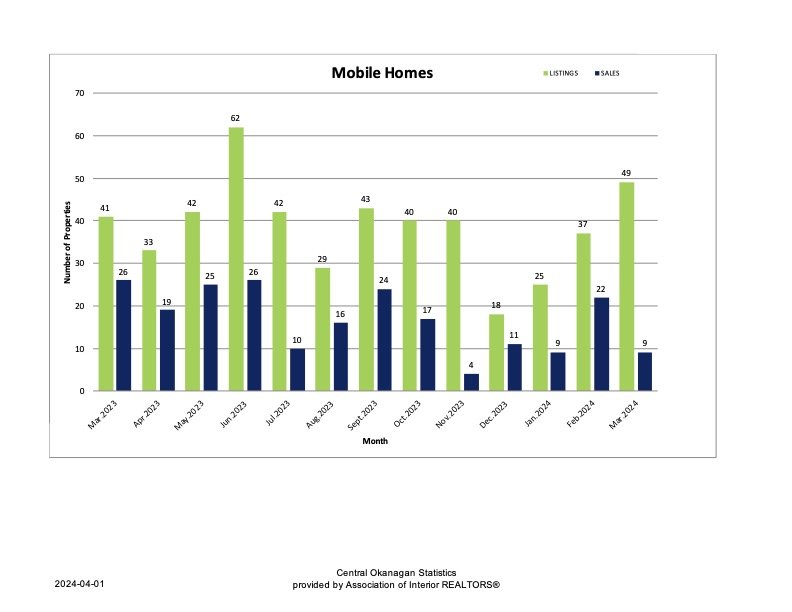
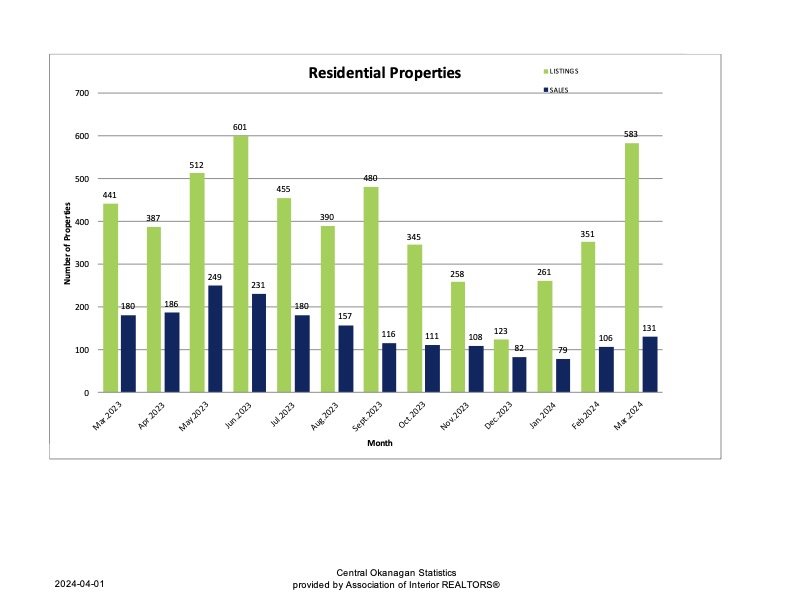
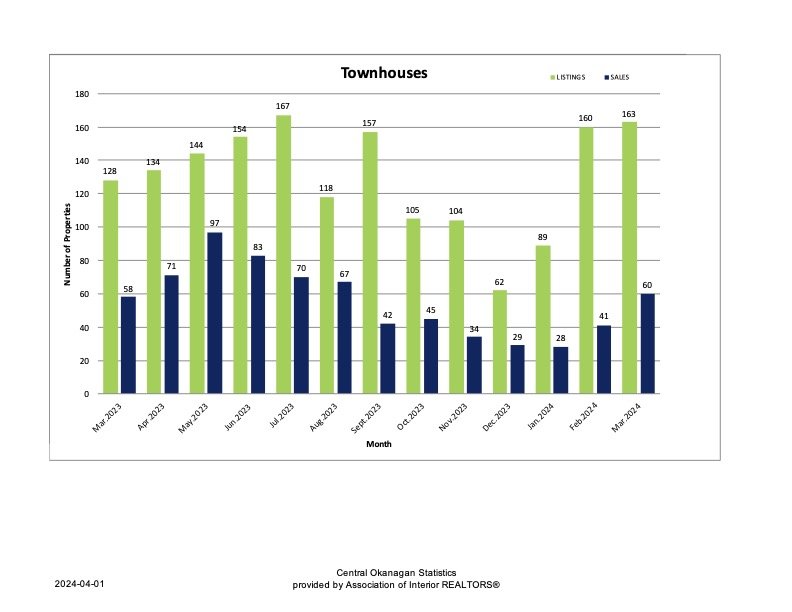
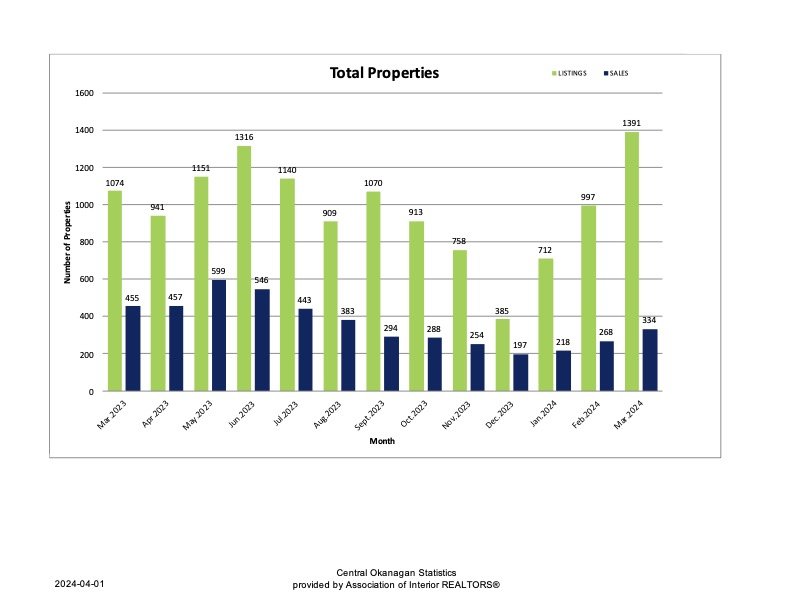
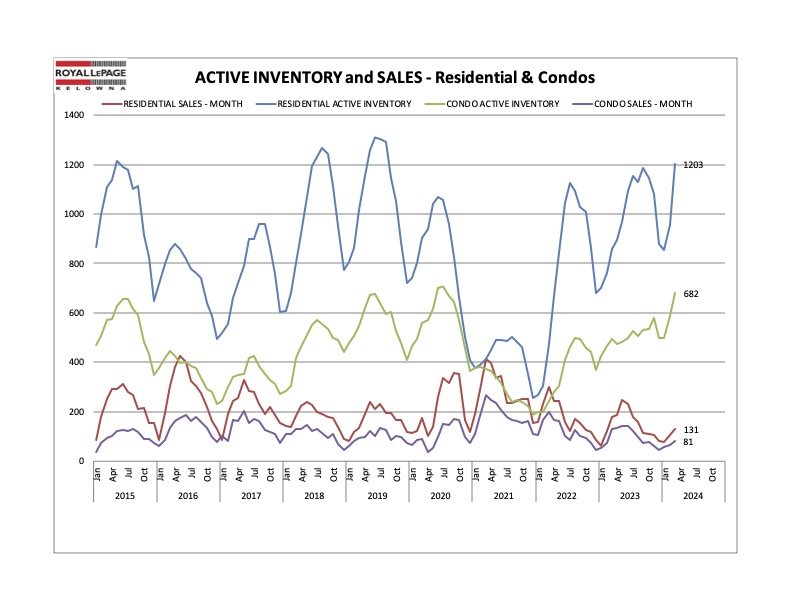
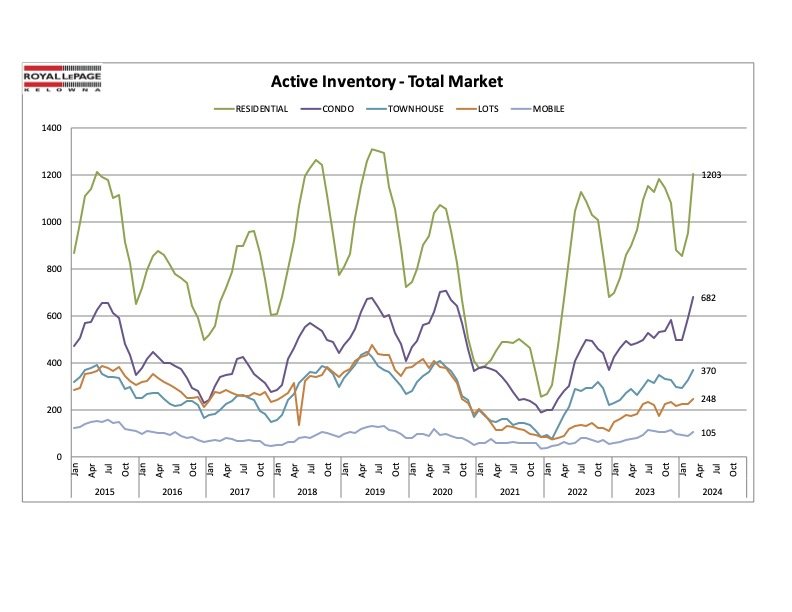
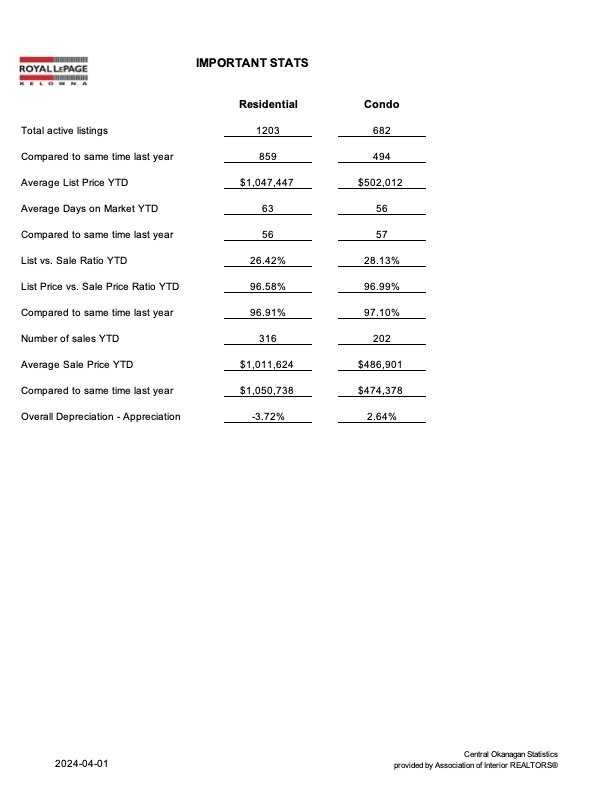
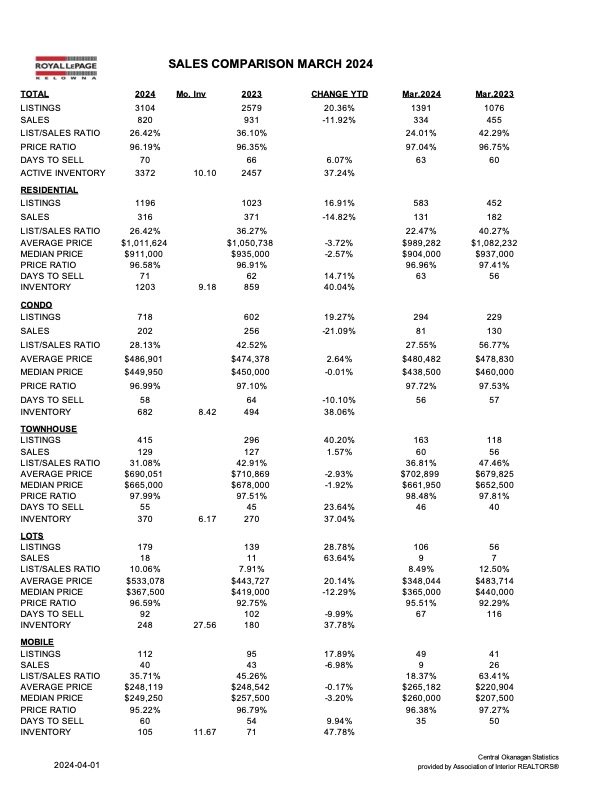
We cover everything from median prices to inventory and sales for a range of property types. Primarily, these statistics cover residential properties and condos, but we also explore townhouses, lots, and mobile homes.
For informational purposes only. Always consult with a licensed real estate professional before proceeding with any real estate transaction.
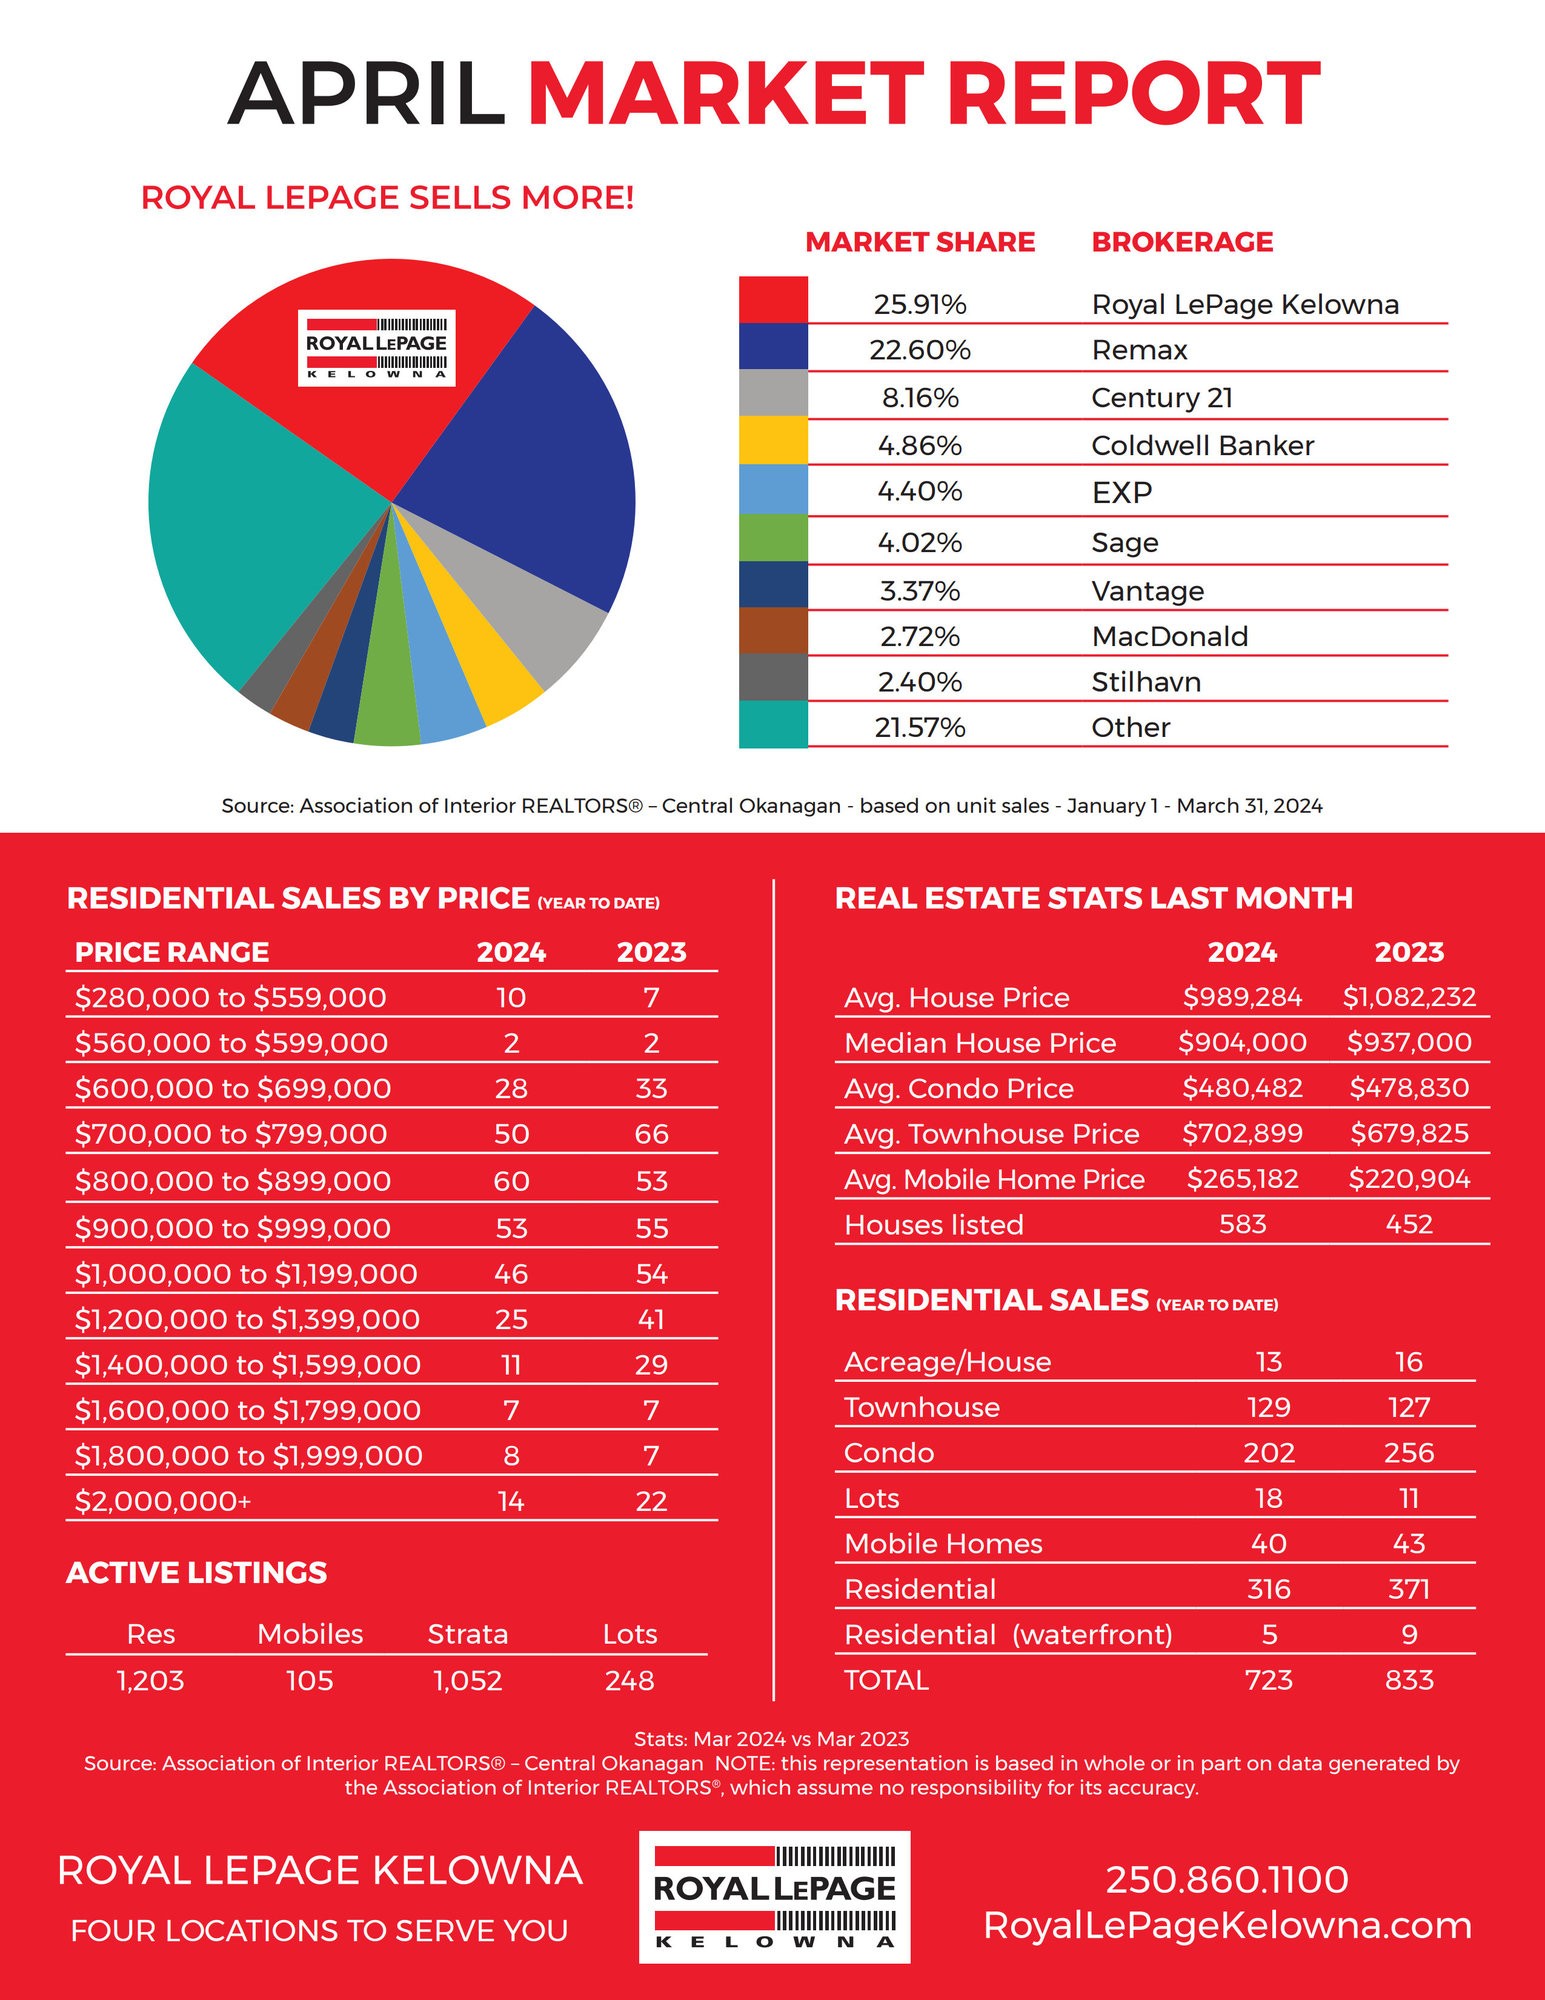
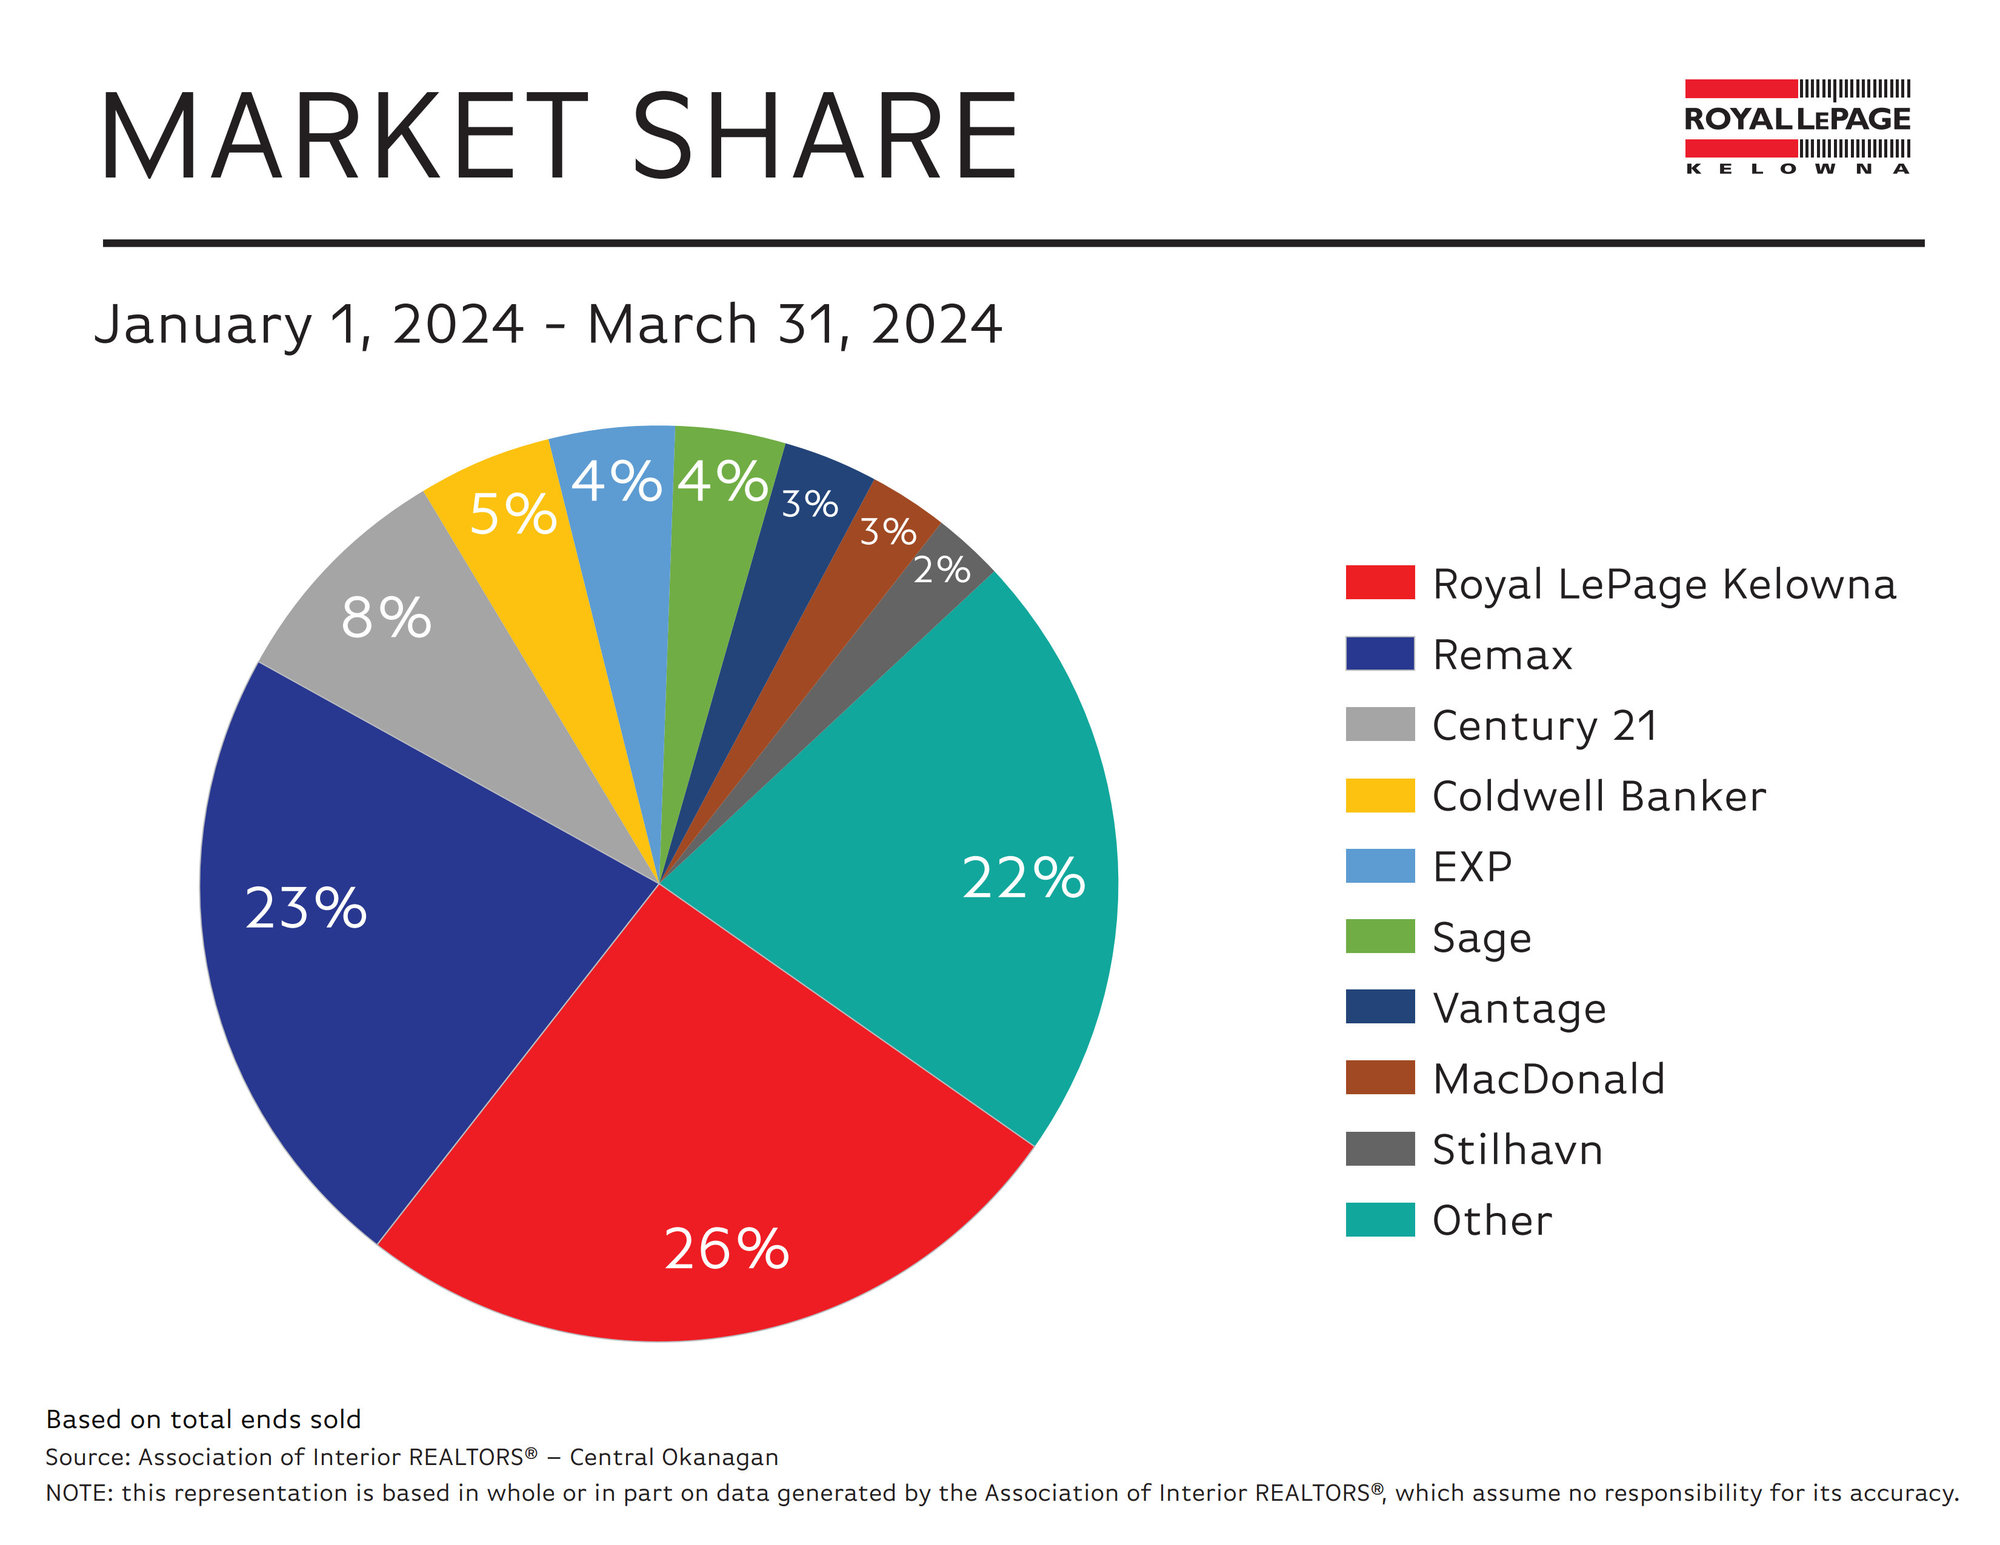
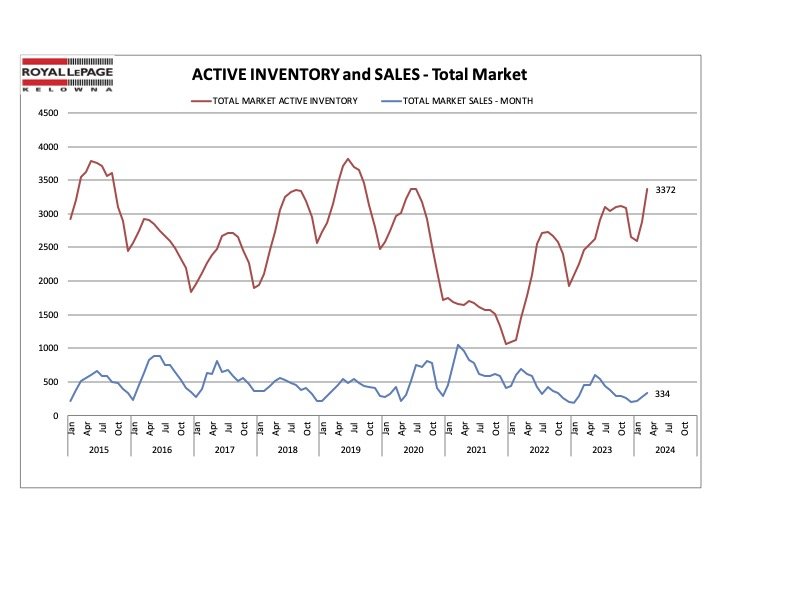
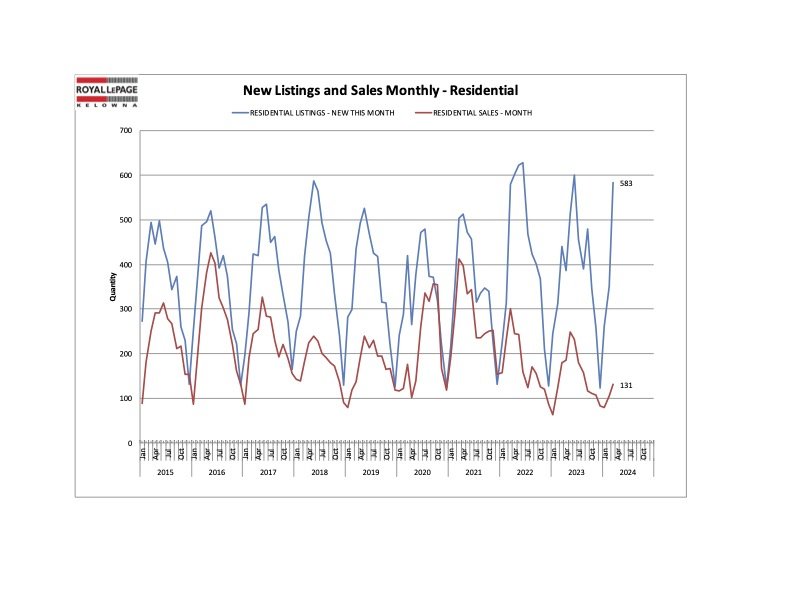
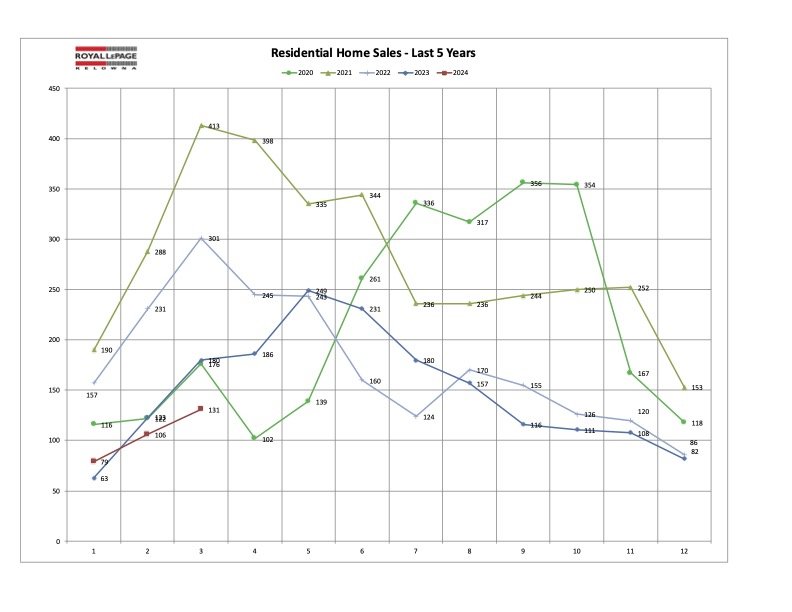
Central Okanagan Real Estate Statistics – March 2024
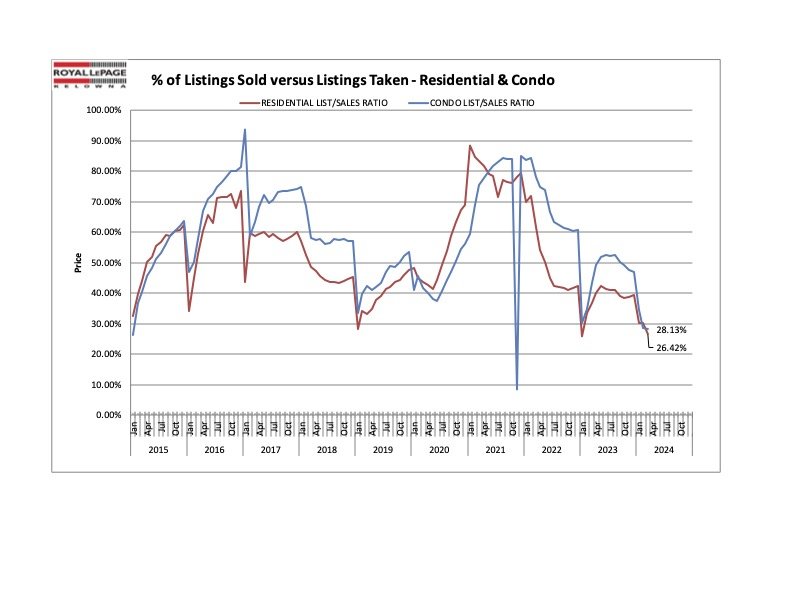
Despite the market's cooling, there's an anticipation of a busier summer season ahead. A notable increase in listings is expected to provide relief to a previously inventory-strapped market. This uptick is attributed to various factors including sellers becoming more inclined to engage in the market due to stabilizing interest rates, upcoming government policy changes affecting vacation home owners, and typical seasonal variations. This is seen as a move towards a more normalized and potentially lively real estate market, offering more options to buyers.
For informational purposes only. Always consult with a licensed real estate professional before proceeding with any real estate transaction.
Dave Kotler